Resources & Tools
The University of Illinois Office of Enterprise Risk Management (ERM) has several Excel-based risk assessment tools/templates which are available to U of I employees. Each of these tools has been constructed to support your risk assessment activities. To find out more about our tools, please contact the ERM office at enterpriserisk@uillinois.edu for information.
- Risk Assessment pdf Form to help describe the risk, identify estimated impact and likelihood, note risk drivers, controls, and control effectiveness. *If the form does not load, download the form and submit from your local desktop. (Firefox browser preferred)
- Risk-Based Budget Planning Tool to consider budget related risks and understand potential benefits of each budget reduction option to help make more informed decisions.
- Risk Map Template to provide data visualization for communicating the status of a series of risks (bubble chart).
- Risk Mitigation Analysis Framework to identify, inventory, and evaluate risk causes and consequences (bowtie analysis).
- Risk Mitigation Plan Template to organize, assess risks, and develop a strategy with steps to reduce the negative effects of risks.
- Risk Response Plan Excel Worksheet to help describe the risk, identify estimated impact and likelihood, note risk drivers, controls, and control effectiveness.
- Glossary of ERM Terms to support a common risk language. You can find this information by clicking on the glossary tab to the left.
- Risk Score Card Matrix to evaluate risk impact and risk likelihood to calculate the risk score. Example is shown below.
- ERM Brochure
Calculate Risk Score
Using the tables below, assess the Impact and Likelihood taking into considation the current controls and mitigation activities. Impact is evaluated on a scale from one to five for each of the four impact areas: Financial, Reputation, Mission/Operations, and Life Safety. The four resulting impact values for each risk are added together, and the total is multiplied by the likelihood or probability of the risk occurring (also reflected on a scale from one to five), producing a current risk score for each risk.
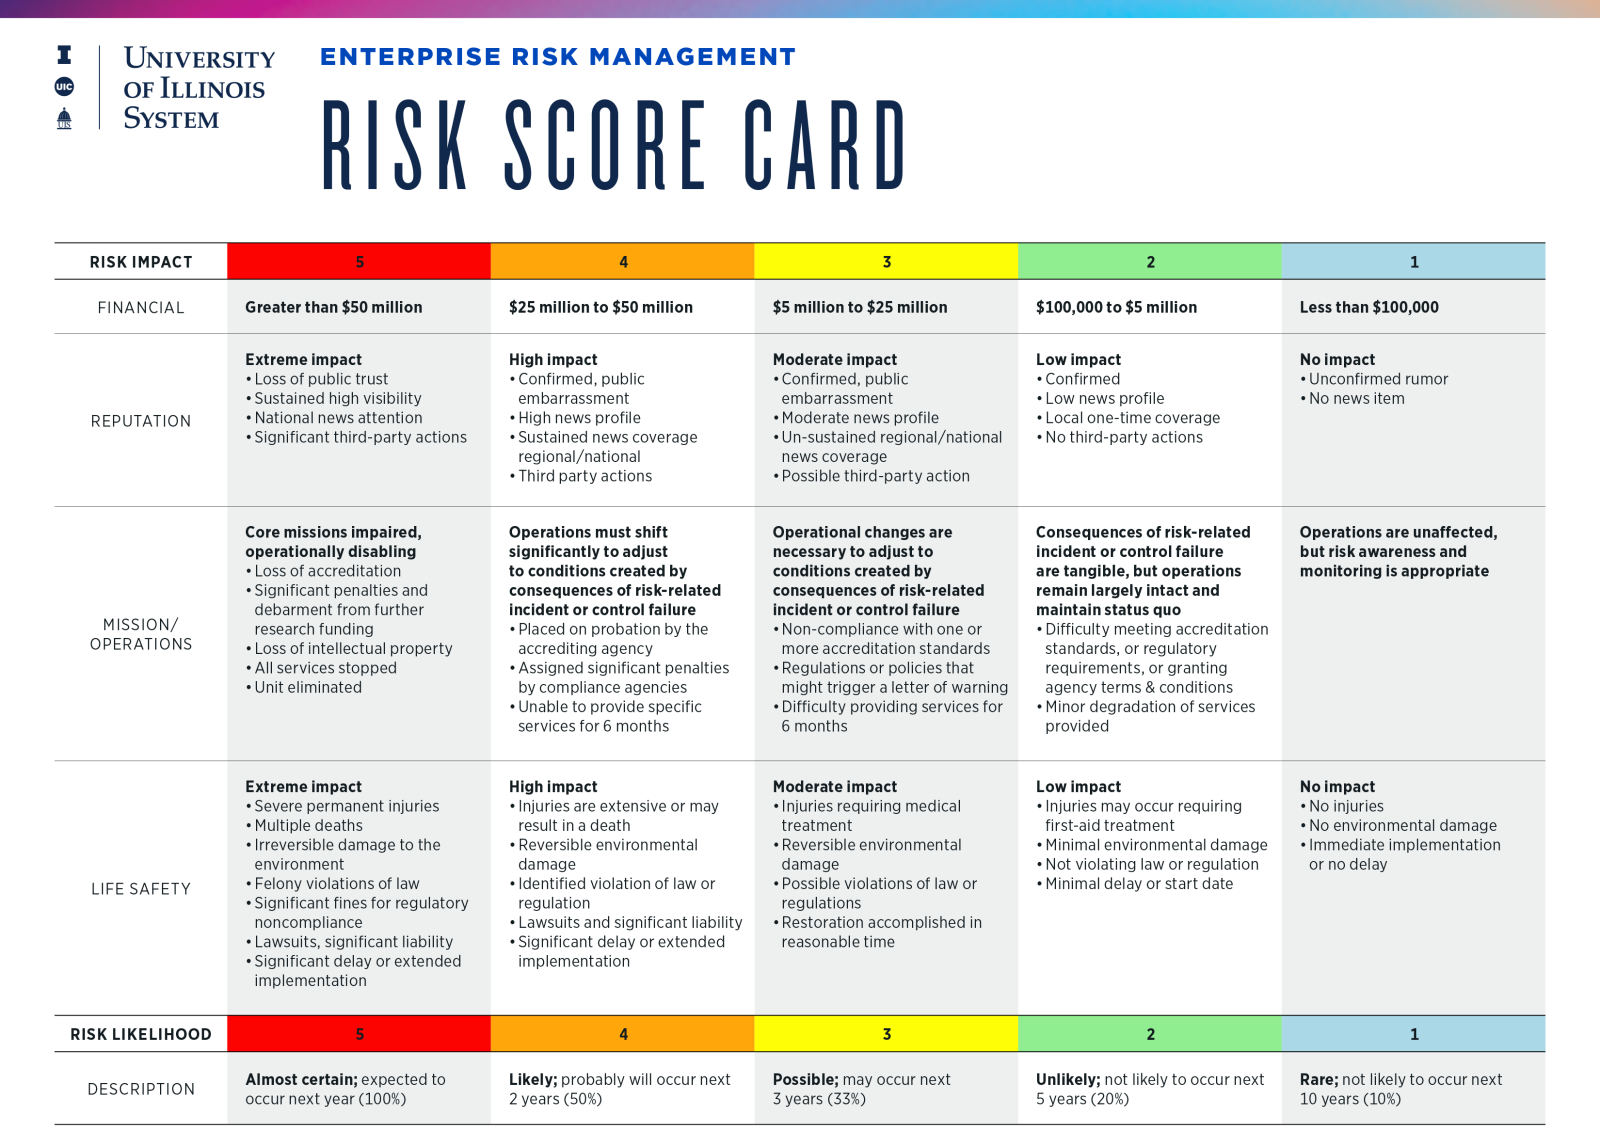
*Risk Score = Impact Sum (Financial impact + Reputation impact + Mission/Operations impact + Life Safety impact) x Likelihood of 1 to 5
Download Risk Score Card PDF here.
Last Updated: May 2024